Osservabilità
Scopri l'importanza dell'osservabilità nell'IA e nell'apprendimento automatico. Impara a eseguire il debug di sistemi complessi, monitorare le prestazioni Ultralytics e ottenere approfondimenti dettagliati sui modelli.
L'osservabilità si riferisce alla capacità di comprendere lo stato interno di un sistema complesso basandosi esclusivamente sui suoi
risultati esterni. Nei campi in rapida evoluzione dell'
Intelligenza Artificiale (AI)
e dell' apprendimento automatico (ML), l'osservabilità va oltre i semplici controlli di stato per fornire approfondimenti sul perché un modello si comporta in un
determinato modo. Come il moderno
architetture di deep learning (DL)
, come l'avanzatissimo
YOLO26, diventano sempre più sofisticate, spesso possono funzionare come "scatole nere". Gli strumenti di osservabilità creano
una finestra trasparente su questi sistemi, consentendo ai team di ingegneri di eseguire il debug di comportamenti imprevisti, tracciare le cause alla radice
degli errori e garantire l'affidabilità negli ambienti di produzione.
Osservabilità vs. Monitoraggio
Sebbene spesso utilizzati in modo intercambiabile, i termini "osservabilità" e "monitoraggio del modello"
monitoraggio del modello hanno scopi distinti
ma complementari all'interno dell'
ciclo di vita MLOps .
-
Il monitoraggio dei modelli
è reattivo e si concentra sulle "incognite note". Prevede il monitoraggio di metriche predefinite come la
latenza di inferenza, CPU o i tassi di errore rispetto a soglie prestabilite. Il monitoraggio risponde alla domanda: "Il sistema è
integro?"
-
L'osservabilità è proattiva e affronta le "incognite sconosciute". Fornisce dati granulari
(log, tracce ed eventi ad alta cardinalità) necessari per indagare su problemi nuovi che non erano stati previsti durante
la preparazione dei dati di addestramento . Come
descritto nel
Google Book, un sistema osservabile consente di comprendere nuovi comportamenti senza distribuire nuovo codice. Risponde alla domanda:
"Perché il sistema si comporta in questo modo?"
I tre pilastri dell'osservabilità
Per ottenere una vera osservabilità nella
pipeline di Computer Vision (CV) , i
sistemi si basano in genere su tre tipi principali di dati telemetrici:
-
Log: registrazioni immutabili e contrassegnate da data e ora di
eventi discreti. In una pipeline di rilevamento, un log potrebbe catturare la risoluzione dell'immagine in ingresso o la specifica
configurazione di ottimizzazione degli iperparametri
utilizzata durante un'esecuzione. Registrazione strutturata, spesso in
formato JSON , consente di effettuare query e analisi complesse
.
-
Metriche: dati numerici aggregati misurati nel tempo, come la precisione media
precisione, consumo di memoria o
GPU .
Strumenti come Prometheus e
Grafana sono standard per l'archiviazione di questi dati temporali al fine di
visualizzare le tendenze.
-
Tracce: il tracciamento segue il ciclo di vita di una richiesta mentre attraversa vari microservizi. Per le
applicazioni AI distribuite, standard come
OpenTelemetry aiutano a mappare il percorso di una richiesta, evidenziando i
colli di bottiglia nel
motore di inferenza o i ritardi di rete
. Strumenti specializzati come Jaeger aiutano a visualizzare
queste transazioni distribuite.
Implementazione dell'osservabilità in Python
È possibile migliorare l'osservabilità nelle pipeline di formazione utilizzando callback per registrare stati interni specifici. L'
esempio seguente mostra come aggiungere un callback personalizzato a un
sessione di formazione YOLO26 per monitorare le
metriche delle prestazioni in tempo reale.
from ultralytics import YOLO

# Load the YOLO26 model
model = YOLO("yolo26n.pt")


# Define a custom callback for observability
def on_train_epoch_end(trainer):
    # Access and print specific metrics at the end of each epoch
    map50 = trainer.metrics.get("metrics/mAP50(B)", 0)
    print(f"Observability Log - Epoch {trainer.epoch + 1}: mAP50 is {map50:.4f}")


# Register the callback and start training
model.add_callback("on_train_epoch_end", on_train_epoch_end)
model.train(data="coco8.yaml", epochs=3)
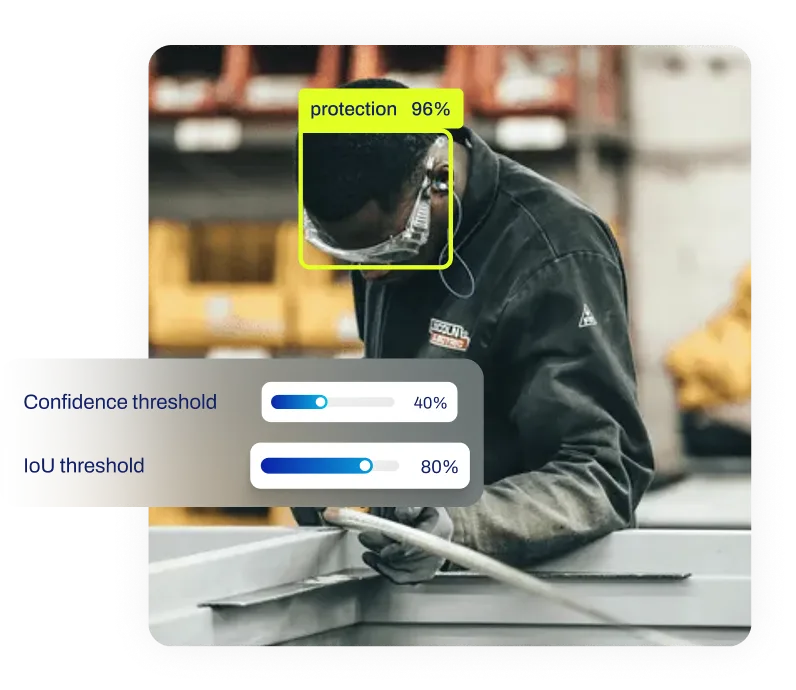
Applicazioni nel mondo reale
L'osservabilità è fondamentale per l'implementazione di modelli ad alte prestazioni in ambienti dinamici in cui
i dati di test potrebbero non corrispondere perfettamente alle
condizioni del mondo reale.
-
Veicoli autonomi: nello sviluppo dei
veicoli autonomi, l'osservabilità consente agli ingegneri di ricostruire lo stato esatto del sistema durante un evento di disimpegno. Correlando
il
rilevamento degli oggetti con i
registri dei sensori e i comandi di controllo, i team possono determinare se un errore di frenata è stato causato dal rumore del sensore, da un errore di previsione del modello
o da un errore logico nel modulo di pianificazione.
-
Diagnostica sanitaria: nell'
AI in ambito sanitario, garantire prestazioni costanti è fondamentale per la sicurezza dei pazienti. Gli strumenti di osservabilità sono in grado di detect
la deriva dei dati se le prestazioni di un modello
si riducono quando viene applicato a immagini provenienti da un nuovo tipo di scanner MRI. Le tracce possono rivelare se il problema deriva da una modifica
nei dati dell'immagine
pre-elaborazione dei dati dell'immagine o a uno spostamento
nella distribuzione degli input, consentendo una rapida correzione senza compromettere la
sicurezza dell'IA.
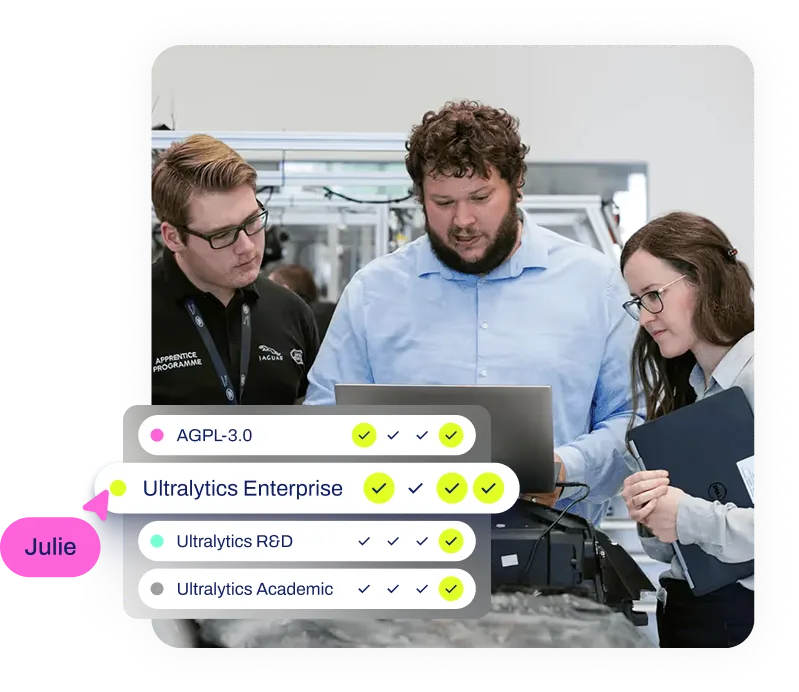
Integrazione con strumenti moderni
I flussi di lavoro moderni spesso integrano l'osservabilità direttamente nella piattaforma di formazione. Gli utenti della
Ultralytics beneficiano della
visualizzazione integrata delle curve di perdita, delle prestazioni del sistema e dell'analisi dei set di dati. Inoltre, le integrazioni standard con strumenti
come TensorBoard e
MLflow consentono ai data scientist di
mantenere un rigoroso monitoraggio degli esperimenti e l'osservabilità durante l'intero ciclo di vita del modello.


.webp)