


Learn how you can use experiment tracking to streamline your Ultralytics YOLO11 experiments with the DVC integration for better model performance.
.webp)
Learn how you can use experiment tracking to streamline your Ultralytics YOLO11 experiments with the DVC integration for better model performance.
Tracking and monitoring computer vision experiments, where machines are trained to interpret and understand visual data, is a crucial part of developing and fine-tuning Vision AI models like Ultralytics YOLO11. These experiments often involve testing out different key parameters and logging metrics and outcomes from multiple model training runs. Doing so can help analyze model performance and make data-driven improvements to the model.
Without a well-defined experiment tracking system, comparing results and making changes to the models can become complicated and lead to errors. In fact, automating this process is a great option that can ensure better consistency.
That’s exactly what the DVCLive integration supported by Ultralytics aims to do. DVCLive provides a simplified way to automatically log experiment details, visualize results, and manage model performance tracking, all within a single workflow.
In this article, we’ll discuss how to use the DVCLive integration while training Ultralytics YOLO11. We will also take a look at its benefits and how it makes experiment tracking easier for better Vision AI model development.
DVCLive, created by DVC (Data Version Control), is a reliable open-source tool designed for tracking machine learning experiments. The DVCLive Python library provides a real-time experiment logger that makes it possible for AI developers and researchers to track the metrics and parameters of their experiments.
For instance, it can automatically log key model performance metrics, compare results across training runs, and visualize model performance. These features enable DVCLive to help you maintain a structured and reproducible machine-learning workflow.

The DVCLive integration is easy to use and can improve your computer vision projects by providing clear, easy-to-understand data visualizations and analysis tools. Here are some other key features of DVCLive:
As you go through the Ultralytics documentation and explore the available integrations, you might find yourself asking: What sets the DVCLive integration apart, and why should I choose it for my workflow?
With integrations like TensorBoard and MLflow that also provide tools for tracking metrics and visualizing results, it’s essential to understand the unique qualities that make this integration stand out.
Here’s why DVCLive could be an ideal choice for your Ultralytics YOLO projects:
Tracking Ultralytics YOLO11 model training with DVCLive is simpler than you might expect. Once the necessary libraries are installed and configured, you can quickly start custom-training your YOLO11 model.
After training, you can adjust key settings like epochs (the number of times the model goes through the entire dataset), patience (how long to wait before stopping if there's no improvement), and target image size (the resolution of images used for training) to improve accuracy. Then, you can use DVCLive’s visualization tool to compare different versions of your model and analyze their performance.
For a more detailed understanding of the model training process and best practices, check out our documentation for custom-training Ultralytics YOLO models.
Next, let’s walk through how to install and use the DVCLive integration while custom-training YOLO11.
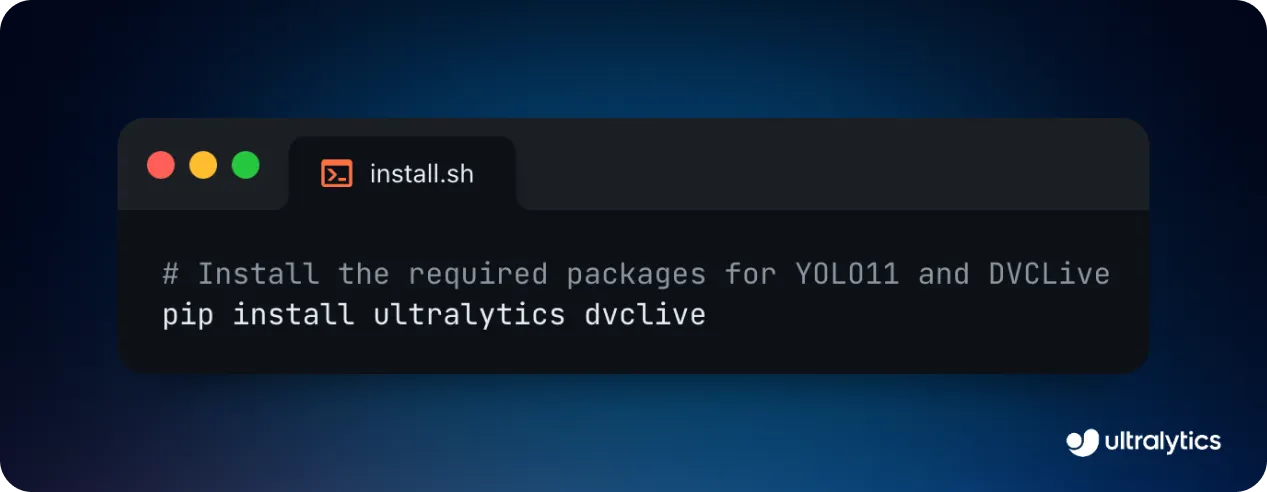
Before you can start training YOLO11, you’ll need to install both the Ultralytics Python package and DVCLive. This integration has been designed in such a way that both libraries work together seamlessly by default, so you don’t need to worry about complex configurations.
The entire installation process can be completed in just a couple of minutes with a single Pip command, which is a package management tool for installing Python libraries, as shown in the image below.
Once you’ve installed the packages, you can set up your environment and add the necessary credentials to ensure DVCLive runs smoothly. Setting up a Git repository is also helpful for keeping track of your code and any changes to your DVCLive settings.
For detailed step-by-step instructions and other helpful tips, check out our Installation Guide. In case you run into any problems while installing the required packages, our Common Issues Guide has solutions and resources to help you out.
After your YOLO11 model training session is completed, you can use the visualization tools to analyze the results in depth. Specifically, you can use DVC's API to extract the data and process it with Pandas ((a Python library that makes working with data easier, like organizing it into tables for analysis and comparison) for easier handling and visualization.
For a more interactive and visual way to explore your results, you can also try using Plotly’s parallel coordinates plot (a type of chart that shows how different model parameters and performance results are connected.
Ultimately, you can use the insights from these visualizations to make better decisions about optimizing your model, hyperparameter tuning, or making other modifications to boost its overall performance.
Now that we’ve learned how to install and visualize YOLO11 training results using the DVCLive integration, let’s explore some of the applications this integration can enhance.
When it comes to agriculture and harvesting crops for food, precision can make a huge difference. For instance, farmers can use YOLO11’s support for object detection and instance segmentation to identify potential crop diseases, track livestock, and detect pest infestations.
In particular, YOLO11 can help catch early signs of plant diseases, harmful pests, or unhealthy animals by analyzing images from drones or cameras. These types of Vision AI systems enable farmers to act quickly to stop problems from spreading, saving time and reducing losses.
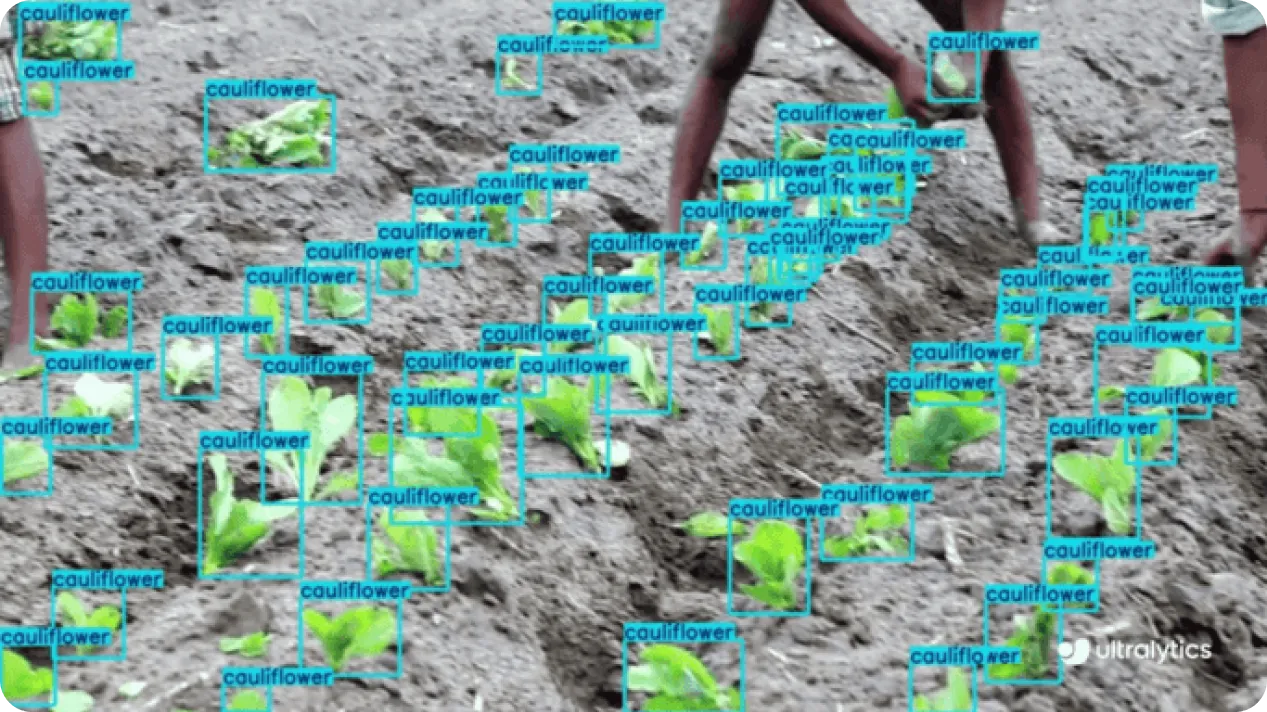
Since farm conditions constantly change with weather and seasons, it’s important to test models on a variety of images to ensure they perform well in different situations. Using the DVCLive integration for custom-training YOLO11 for agricultural applications is a great way to keep track of its performance, especially with diverse datasets.
Retail stores can use AI and computer vision to understand customer behavior and make improvements to enhance the shopping experience.
By analyzing videos from security cameras, YOLO11 can track how people move around the store, which areas get the most foot traffic, and how shoppers interact with products. This data can then be used to make heatmaps to showcase which shelves grab the most attention, how long customers spend in different aisles, and whether advertisement displays are being noticed.
With this business intelligence, store owners can rearrange products to increase sales, speed up checkout lines, and adjust staffing to assist customers where and when they need it most.

Oftentimes, retail stores have unique characteristics, such as varying lighting conditions, layouts, and crowd sizes. Because of these differences, computer vision models used to analyze store activity need to be carefully tested and adjusted for each location to ensure accuracy. For example, the DVCLive integration can help fine-tune YOLO11, making it more precise and reliable for retail applications, enabling better insights into customer behavior and store operations.
Custom-training YOLO11 while using the DVCLive integration makes it easier to track and improve your computer vision experiments. It automatically logs important details, shows clear visual results, and helps you compare different versions of your model.
Whether you're trying to boost farm productivity or improve the shopping experience in a store, this integration ensures your Vision AI models perform well. With experiment tracking, you can systematically test, refine, and optimize your models, leading to continuous improvements in accuracy and performance.
Join our community and explore our GitHub repository to learn more about Vision AI, and check out our licensing options to kickstart your computer vision projects. Interested in innovations like AI in manufacturing or computer vision in self-driving? Visit our solutions pages to discover more.

.webp)